

Important Points regarding Breakout:
1- Breakout from Double Bottom pattern.
2- Went through minor correction post breakout and took support on the neck-line.
3- Breakout from long-term downtrend line resistance too.
4- OI data suggests long build-up.
5- Momentum breakout on indicator.
6- MACD suggests long position.
7- Currently at a historic resistance level. If it breaches this point then it can rise significantly.
What is Double Bottom Pattern?
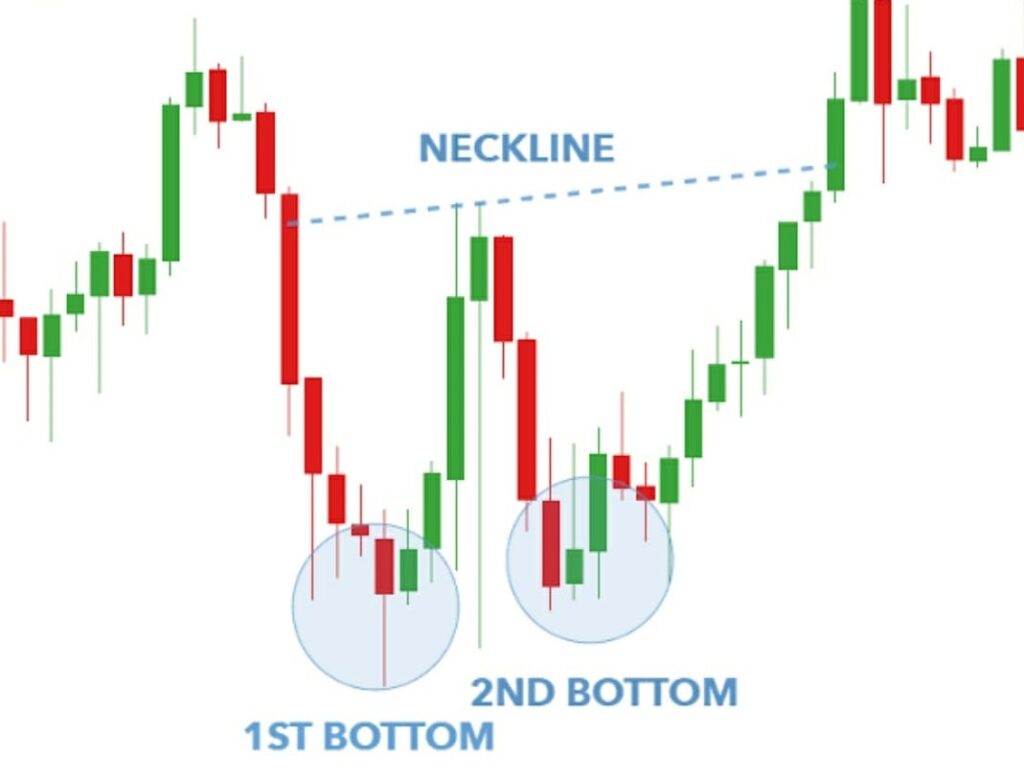
The double bottom pattern is made when the price of an equity touches the same level twice following a major or minor down trend, and signals the reversal and the beginning of a potential uptrend. Consequently, the pattern should be validated by market fundamentals for the security itself, as well as the sector that the security belongs to, and the market in general. Also, volume should be closely monitored during the formation of the pattern.
A spike in volume typically occurs during the two upward price movements in the pattern. These spikes in volume are a strong indication of upward price pressure and serve as further confirmation of a successful double bottom pattern.
Once the closing price is in the second rebound and is approaching the high of the first rebound of the pattern with a noticeable expansion in volume, a long position should be taken at the price level of the high of the first rebound, with a stop loss at the second low in the pattern. A profit target should be taken equal to the difference between bottom and neck-line, from the point of breakout.
Above Information is for educational purpose only. No trades solicited.