
Tata Power with a market capitalization of more than 78,000 Crores and a profit of more than 2000 crores with an EBITDA of 12.6 is a stock with strong fundamentals. With a CAGR (5 Years) of around 24% and CAGR (3 years) of 56%, this stock is giving its investors good returns.
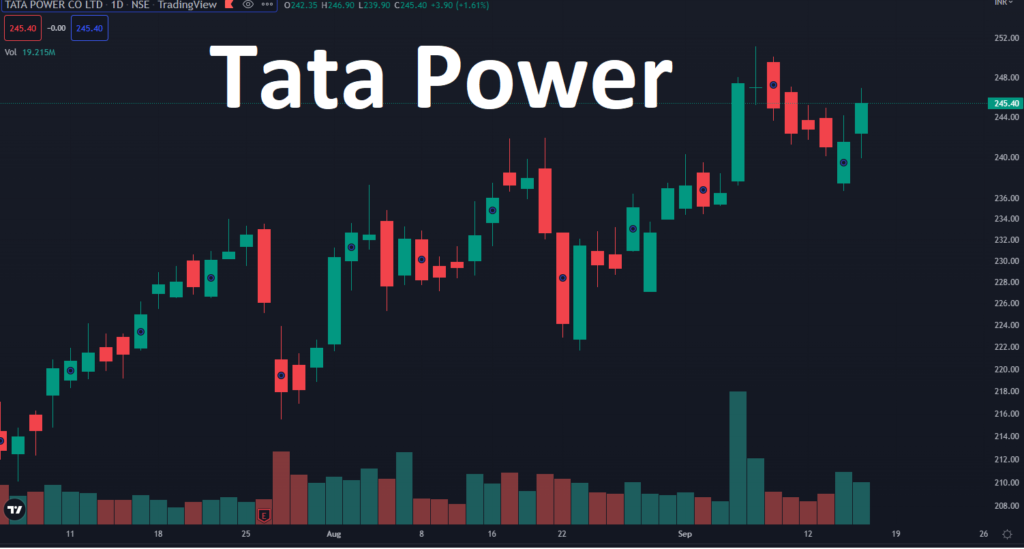
Technically, Tata Power after making bottom around 190 levels, moving up steadily forming higher tops and higher bottoms. After bottoming out at 190, Tata Power broke out from Inverse Mountain and Hill pattern at 212 as depicted below:

212 was the first level where Tata Power can be entered for long term as depicted above. After that it kept moving up slowly and steadily.
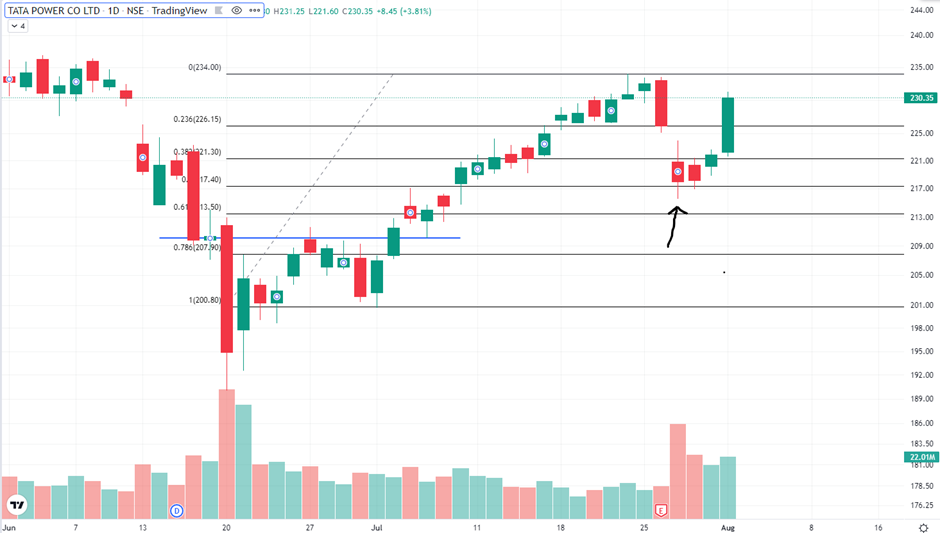
On 26 July 2022, Tata Power corrected from 234 levels and it indicated 2 days before by forming shooting star pattern. On 26 July 2022, it formed Dark Cloud and that’s the day when short term traders or swing traders would have exited using the candle stick patterns as depicted in the picture below:

Now, as Tata Power started correcting, Fibonacci levels can be used to check the potential support points and if it is checked Tata power took support at exact 50% of Fibonacci level and started its upward movement again as depicted below:
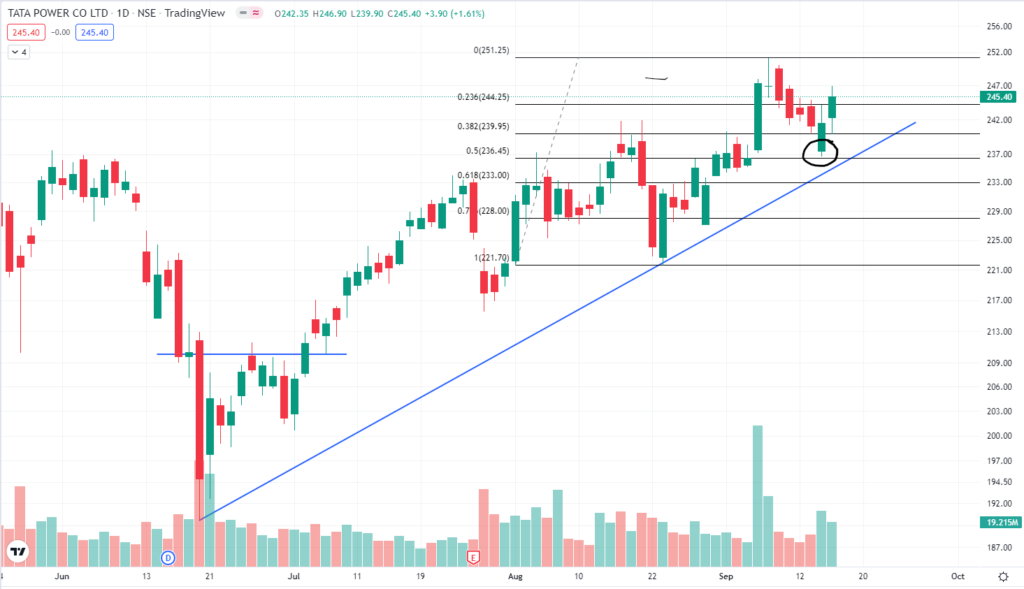
As Tata Power kept correcting and moving up, we got the potential points for the trendline. Today, at the present scenario it already took support from 50% Fibonacci levels with increased volumes as depicted below. Tata Power now can achieve the targets in the range of 270 – 280 within a matter of time.
Above Information is for educational purpose only. No trades solicited.
Good analysis!
Thank you very much !!!